VIDEO: NASA Looks At Deadly Weather Over Central United States
By Space Coast Daily // December 30, 2015
rainfall totals of almost 36.8 inches RECORED
ABOVE VIDEO: This animated NASA rainfall analysis from Dec. 23 to 27, 2015 showed highest rainfall totals of almost 36.8 inches were measured by IMERG in the state of Alabama. (NASA.gov video)
NASA’s Global Precipitation Measurement or GPM mission core satellite analyzed extreme weather that affected the U.S. over the course of five days.
Heavy rainfall, flooding and tornado outbreaks affected areas of the United States from the Southwest through the Midwest from December 23 to 27, 2015.
GPM is an international satellite mission between NASA and the Japan Aerospace Exploration Agency to provide next-generation observations of rain and snow worldwide every three hours.
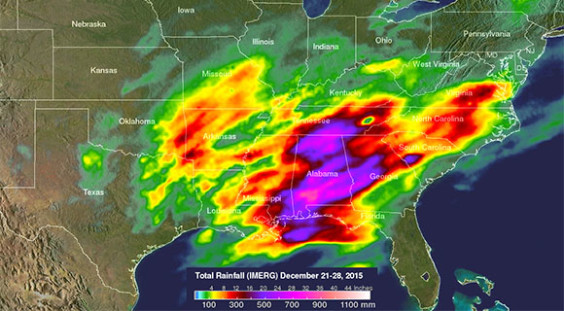
An analysis was made of the rainfall that occurred during the period from December 21 to 28, 2015.
This analysis used data generated by NASA’s Integrated Multi-satellitE Retrievals for GPM (IMERG). This analysis showed that during the past week the highest rainfall totals of almost 938 mm (36.8 inches) were measured by IMERG in the state of Alabama.
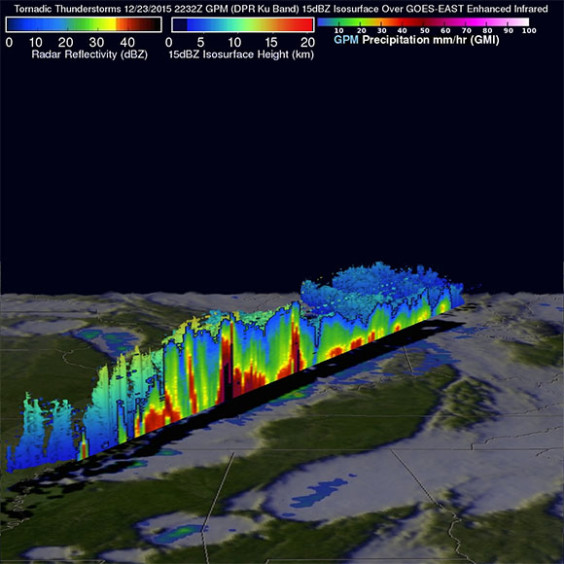
The GPM satellite passed above a line of tornadic thunderstorms moving through the Midwest on December 23, 2015 at 2232 UTC (5:32 p.m. EST).
GPM’s Microwave Imager (GMI) and Dual-Frequency Precipitation Radar (DPR) instruments had an excellent view of the violent weather occurring near the center of the satellite’s swath. The supercell thunderstorm that moved from northern Mississippi into Tennessee generated two tornadoes.

Fourteen deaths alone occurred with tornadoes that hit Benton, Mississippi on December 23, 2015.
GPM’s Radar (DPR Ku band) revealed the intensity of thunderstorms within this line of powerful storms. Many of those thunderstorms contained heavy showers that were returning 45 dBZ values or greater to the satellite (dBZ values (decibels of Z) represent the energy reflected back to the GPM satellite).
At NASA’s Goddard Space Flight Center in Greenbelt, Md. the data was used to create a color enhanced 3-D view of the GPM radar’s slice through the line of storms.

The low pressure area that brought the severe weather moved into the Great Lakes region on Dec. 29 bringing rain and snow from the Middle/Upper Mississippi
Valleys across the Great Lakes and into New England.
The National Weather Service Weather Prediction Center (NWS/WPC) in College Park Md. stated in the Dec. 29 Short Range Forecast Discussion that residual flooding and/or the threat for flooding will persist from Oklahoma to Illinois. NWS/WPC noted that several rivers across the Midwest were out of their banks on Dec. 29. Several locations along the Mississippi River from St. Louis down to the delta are anticipating major flooding, possibly even breaking record flood levels. For updated forecast summaries from NWS/WPC, visit: www.wpc.ncep.noaa.gov.
For more information about GPM, visit: www.nasa.gov/gpm
CLICK HERE FOR MORE SPACE NEWS