NASA Satellites Track Tropical Depression Arthur
By NASA.gov // July 2, 2014
Tropical Rainfall Measuring Mission
ABOVE VIDEO: Arthur, the first named storm in the Atlantic hurricane season, could threaten some Fourth of July celebrations on the Space Coast.
Last Sunday, the Tropical Rainfall Measuring Mission, or TRMM, satellite flew over a low-pressure center east of Florida.

This low-pressure area developed over South Carolina and moved east into the Atlantic Ocean where the warm waters of the Gulf Stream helped fuel it.
NASA’s TRMM satellite uses different instruments that allow scientists on Earth to create 3-D images of those storms so they can see where the most powerful areas are within it.
A NASA rainfall analysis made on June 29 that used data from TRMM’s Microwave Imager and Precipitation Radar (PR) instruments showed that rainfall was only light to moderate near the center of the low.
At NASA’s Goddard Space Flight Center in Greenbelt, Maryland, the TRMM science office also created a simulated 3-D view of rainfall using TRMM PR data that showed most of the convective (rising air that forms clouds and thunderstorms) showers and thunderstorms near the center of the low were only reaching altitudes of about 6.2 miles (about 10 km).

A few of the outer rain bands contained powerful thunderstorm “hot towers,” or towering clouds that reached heights of about 8 miles (13 km) indicating strong thunderstorms with heavy rainfall potential.
On June 30 at 3 p.m. EDT the Moderate Resolution Imaging Spectroradiometer instrument aboard NASA’s Aqua satellite captured an impressive visible image of Tropical Depression 1 off the coast of central Florida. The image showed some powerful, high thunderstorms over the Bahamas. In visible imagery, the strongest thunderstorms are identified as the highest ones that cast shadows on the clouds below them.

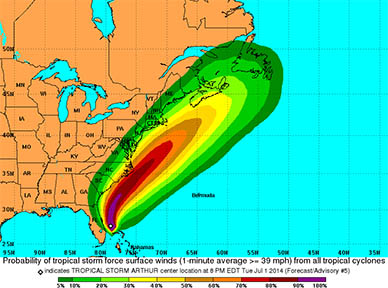
On July 1 that area of low pressure developed into Tropical Depression 1. The National Hurricane Center issued a Tropical Storm Watch for the east coast of Florida from Fort Pierce to Flagler Beach.
The National Hurricane Center (NHC) noted at 8 a.m. EDT (1200 UTC) that the center of Tropical Depression 1 was located near 27.5 degrees north latitude and 79.2 degrees west longitude. That’s just about 95 miles (155 km) southeast of Cape Canaveral, Florida. The depression has remained nearly stationary during the past few hours.
A northwestward motion is expected to begin later today, followed by a turn toward the north on Wednesday. Maximum sustained winds are near 35 mph (55 kph). The estimated minimum central pressure is 1007 millibars.


