
How to Use Stock Market Data for Smarter Investment Research
By Space Coast Daily // September 22, 2026
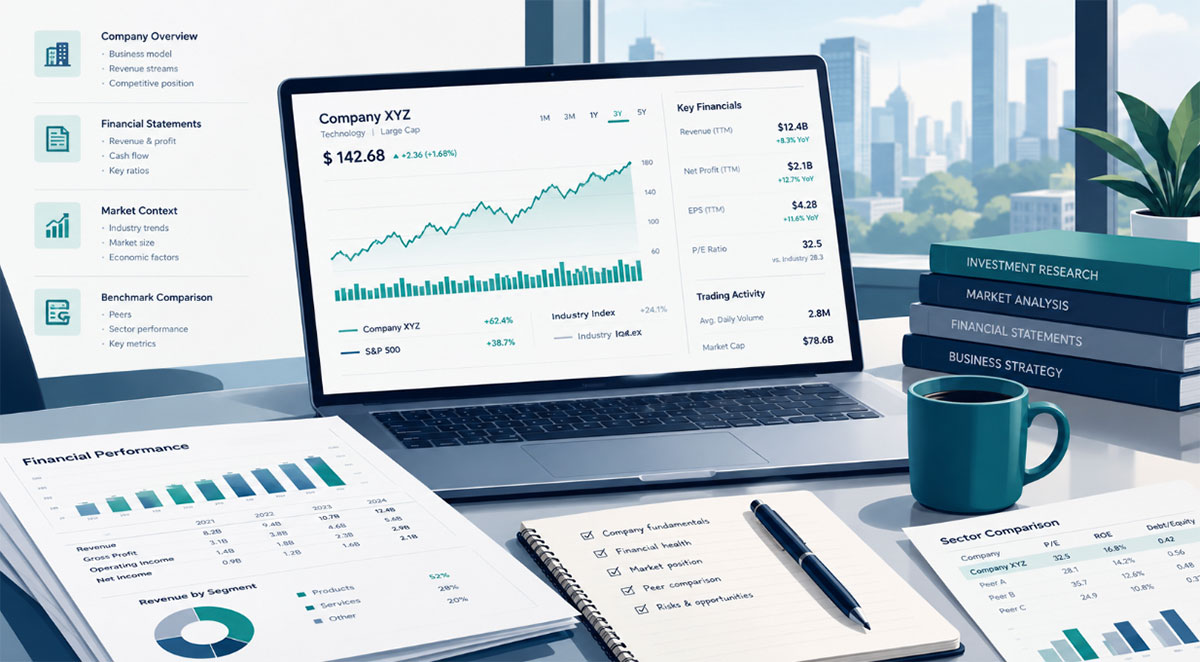
Investment research benefits from having the right information at hand. Before buying or selling a stock, investors may benefit from learning more about the company behind the share, reviewing a firm’s financial situation, looking at market activity,y and comparing the shares against relevant benchmarks. Stock market data can aid each of these areas by turning individual market movements into information that can be systematically analyzed.
The difficulty is not finding more data. As an investor, you can find prices, financial reports, trading levels, company announcements, and a wealth of market indicators. The more challenging task is knowing what information matters and how different data points relate. A structured approach to stock market data can enhance your research and give a better overall perspective of a company and the market in which it operates.
What Stock Market Data Actually Tells You
Stock market data includes several different types of information that describe how a security and the market around it operate. Price is one of the most immediate data points. Looking at current and historical prices can give an indication of how a stock is performing over different periods, although a single price increase or decrease rarely provides enough information to understand a movement.
Trading volume provides another layer by describing how many shares have changed hands during a specific period. Market capitalization is also important for providing a sense of the size of a publicly listed company. A look at historical performance, sector information,n and broader market benchmarks can then help add additional context to a stock’s performance. When considering these areas together, it becomes possible to move away from simply focusing on a rising or falling stock price and consider the conditions under which those movements occurred.
Start With the Company Behind the Stock
Market data is only part of one’s research. A stock represents ownership in a business, which means understanding a company is key to comprehending a stock. Researchers can begin by examining the company’s business model, products or services, target market, and competitive landscape. Financial details can then provide a better perspective of how a business is doing.
Revenue can give an indication of how much business is being conducted, while earnings can give information on how profitable those activities are. The balance sheet can show assets, liabilities, debt,t and shareholder equity, while cash flow statements can provide yet another perspective of the flow of money in a business. Company filings and disclosures are of greatest importance as they provide first-hand information connected to a company’s operations and financial situation. Adding data from primary sources to your research on market data can provide a better overall picture.
Look at Price and Trading Activity Together
Price movements become more insightful when viewed alongside other trading activity. If a stock experiences a significant amount of movement with unusually high trading levels, that movement deserves more attention. The reason could be a company announcement, earnings, broader market movements, or any number of other catalysts that are affecting investors.
This does not mean that a particular combination guarantees a future market outcome. Those figures can nevertheless help point to relevant events that should be examined further. Liquidity is another consideration. A stock with low trading activity can behave very differently from a highly liquid security in terms of how investors are able to purchase or sell. Considering trading activity alongside price history can therefore provide helpful perspective on your research process.
Compare Data Across Different Time Periods
One of the benefits of stock market data is the ability to look across different time periods. Short-term movements can indicate recent market activity, while longer periods can show the performance of a company or sector through a series of markets.
Quarterly and annual financial information can also add insight as to what has changed that may not be evident with day-to-day movements. Comparison is also useful. A company’s performance can be benchmarked against its sector, an appropriate market index, or against comparable firms to see if a stock’s movement applies to more than one entity.
Historical performance should always be a reminder of something that has occurred, not a guarantee of what will take place in the future. Markets can evolve, companies can transform, and the economic landscape can change considerably over time.
Use Multiple Sources to Verify Your Research
Reliable research does not usually rely on one source. Company filings can provide relevant financial and operational data, market-data sources can supply information on prices and trading, industry publications can offer context on the sector in which a firm operates,s and company announcements can clarify relevant developments that may affect a business.
Having multiple sources also provides the opportunity to verify them against one another. If one source shows one set of figures and another source presents a different set of figures, that discrepancy should be identified and investigated. Regulatory authorities are also excellent sources for looking at company filings, such as the SEC’s EDGAR system in the United States for information from publicly listed companies.
The goal is not to gather every possible piece of information. The goal is to build a reliable pool of data that can answer the questions you want to investigate.
Where Organized Stock Data Can Improve Your Research
Research is more efficient when information can be gathered and analyzed in an organized manner. Instead of hunting down data points randomly, you can take a stock information sheet and verify crucial elements of the source.
If an investor researches companies, share prices, es and market activity regularly, for example, 주식디비 can be used as a reference when you need to gather and review stock-related information in a more organized research process. The value of a stock-data repository is tied to what the available information can do to facilitate your own specific needs and how key figures will then be verified.
This approach serves to keep the role of a stock-data resource grounded. Its value is in providing information-gathering assistance, not in interpreting and verifying that information directly.
Turn Data Into a Repeatable Research Process
Once relevant information has been gathered, the next step is to turn it into a repeatable research process.
Collect and Verify the Right Information
Begin by gathering company, financial, and market information that is relevant to your research question rather than merely collecting data for the sake of having lots of data. As you identify important figures, they should be verified against reliable primary or authoritative sources while examining reporting periods, dates and differing presentations of information.
Compare, Interpret and Reassess
The next step is to look at information across different time periods, sectors, companies or appropriate benchmarks. Information can then be interpreted in the context of the company’s business and current market circumstances. With financial reports, company announcements,s or significant market developments coming to market, the research can be reassessed and updated accordingly.
This structure can be vital to preventing research from becoming a compilation of random numbers. Every piece of information has a specific role and can be part of a broader picture.
Why Context Matters in Stock Research
Numbers can appear to be meaningful without necessarily providing enough information to form a useful conclusion. A rising stock price, for example, is not an explanation for why that price has increased. Strong revenue growth does not automatically answer whether a firm’s valuation is rational. High trading volume does not necessarily dictate whether market activity will be in one direction or another.
Context ties together these data points. By combining a stock’s financial details with historical market data, trading activity, developments that affect the business, ss and market conditions of a relevant sector, researchers can look at a stock from multiple perspectives, not just one.
Conclusion
Stock market data can be a valuable basis for investment research if it’s systematically gathered and presented. Price history, trading activity, financial statements, company disclosures, and market comparisons each offer different pieces of a picture.
The aim is not to predict markets from a single data point. A sound research process then focuses on the use of relevant information, verifying important details and comparing evidence against appropriate periods and sources.
With a structured approach, stock market data can be transformed into more than a series of numbers. It can become a practical research tool to understand companies, markets,s and their associated dynamics.